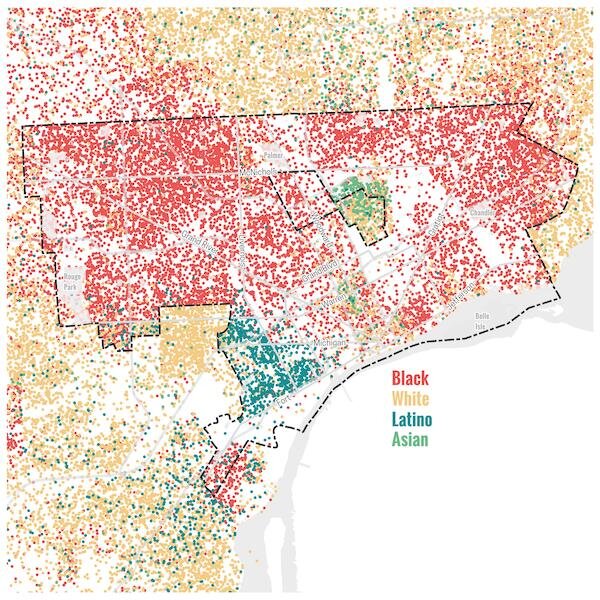
Mapping Detroit: Racial dot map
One limitation of Census data is that much of Detroit is categorized as “hard to count” meaning the Census is the best data we can get, but it might not be the best representation of everyone in Detroit.
This is part of a series from the unofficial cartographer of Detroit, Alex B. Hill, a self-described “data nerd and anthropologist” who combines mapping, data, and analytics with storytelling and human experience. He is the founder of DETROITography and author of “Detroit in 50 Maps.”
I decided to share this map from my book, Detroit in 50 Maps, because I’ve seen a lot of the old maps from 2010 and 2000 shared. I get regular requests to update this kind of “racial dot” map whenever there is a new set of Census data. On this map in particular one dot equals 25 people and data come from the 2020 Decennial Census.
Not too much has changed from the 2000 or 2010 maps except for the significant population losses. The border of Detroit can still be easily picked out without needing the boundary line drawn. Some notable differences from the 2020 Census data is the increased Downriver migration of Latino populations as noted in my mapping of taco places with Tostada Magazine as well as the continued growth of the Bangladeshi community in Hamtramck and bordering areas within Detroit.
An important limitation of the Census data is that race and ethnicity are not well defined for all people. For Southeast Michigan, that means that the Middle East/ North African populations are grouped into the “white” racial category. The other limitation is that much of Detroit is categorized as “hard to count” meaning the Census is the best data we can get, but it might not be the best representation of everyone in Detroit.
Author

Related Articles
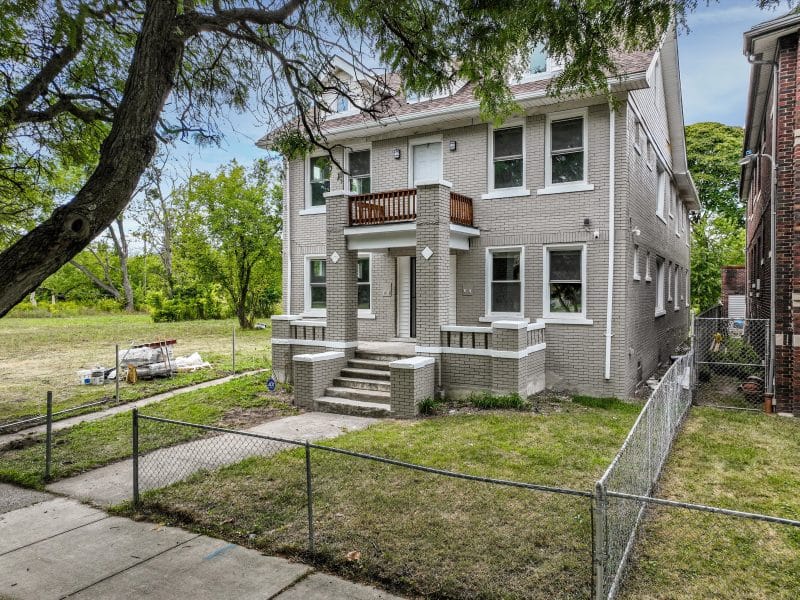
Community developers’ pride for area fuels investment, catalyst for change, growth in Detroit neighborhoods
Community developers know, care for, and invest in their neighborhoods. Together with community development institutions (CDFIs), small development projects can have a huge impact on their neighborhoods, serving as a catalyst for future growth.
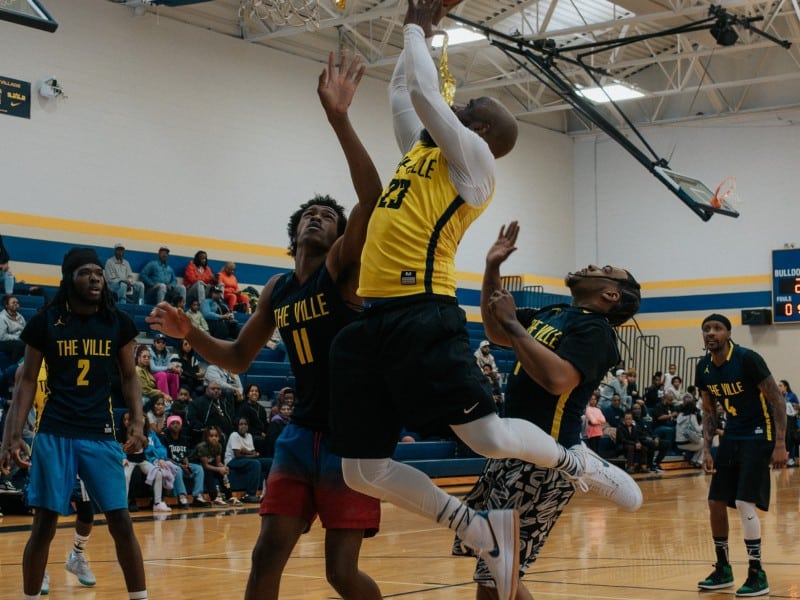
Detroit Veteran Returns Home to Build a Future for Youth Through Outside the Box
Through basketball, community partnerships and a shared commitment to Detroit’s future, Outside the Box is creating new opportunities for the city’s next generation.
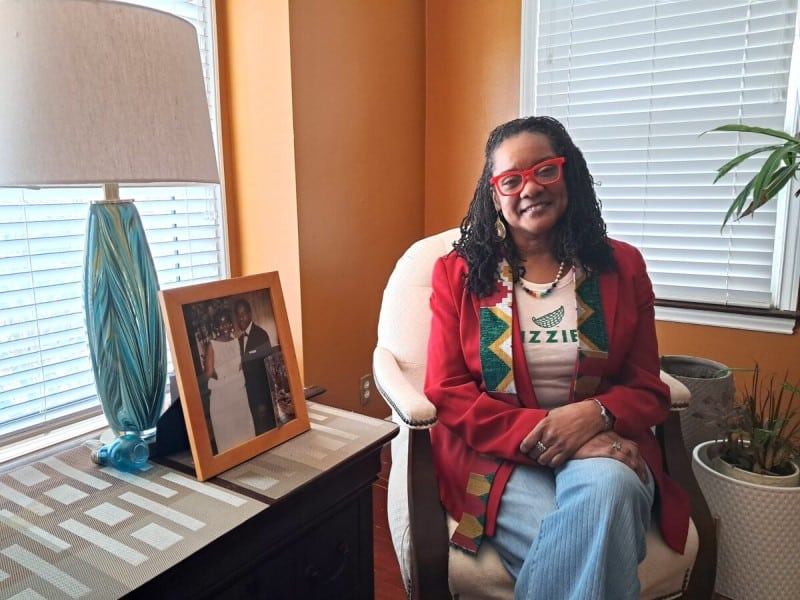
From ‘Tire Lady’ to community stewardship maven: Audra Carson’s evolving mission
Audra Carson’s journey from corporate analyst to founder of Izzie Global shows how one person’s commitment to environmental justice can transform Detroit neighborhoods—even after devastating setbacks.
